Like it or not, your audience is the best judge to evaluate your video content on YouTube.
YouTube`s Audience Retention Analytics does that for you. It represents what your audience finds interesting or encourages them to click away.
But here are several points to remember about YouTube videos before delving into Audience Retention.
Audience Views – Weak Indicators Of Engagement on YouTube.

While it`s appealing to see 200K views below your video, YouTube downgraded the importance of this statistic in ranking videos because it’s difficult to evaluate engagement.
For example, if 90 percent of viewers leave in the first five seconds, it still adds to the count.
Furthermore, it’s open to abuse. Some websites offer the opportunity to “buy” views for as little as $20 per 10,000 views.
Total Watch Time Is A Key Statistic.
In 2012, YouTube began using “Watch Time” as a main factor in determining how it ranks videos.

“We’ve started adjusting the ranking of videos in YouTube search to reward engaging videos that keep viewers watching,” says the Official YouTube Partners and Creators Blog.
Therefore, shorter is not always better in YouTube terms.
For example, a minute long video that retains 100% of its audience, may not do as well in terms of ranking as a 10 minute video that keeps only 60% of its audience. The longer video represents six minutes of “Watch Time” compared to the one minute in the shorter video.
Therefore, content should be a length that is appropriate for your audience. If your content is about one minute meal plans keep it to a minute. But if it’s a seminar then longer is likely more appropriate.
How To Judge the Quality of Your Content In Terms Of Audience Engagement
YouTube provides two analytics that allow you to judge your specific video to find within your content exactly where it is either weak or strong in terms of audience engagement.

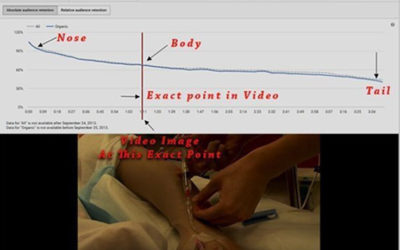
The Audience Retention graph is directly tied to your video. If you play the video below the graph, you can see when your audience clicks away and how many stick it out to the end.
A standard Audience graph has three segments: the nose which represents the first few seconds of the video, the body which represents the bulk of your video and the tail which is the closing moments.
The nose will usually have a sudden drop in the size of the audience. It means people are clicking away from your video in relatively large numbers.
This is expected.
Not everyone will be interested in your content. But a really dramatic dip may indicate problems with your opening segment. For example, is it time to ditch your five seconds of logo or opening graphics (that you thought were really spiffy) and go directly to the content. Have you mislabelled your video with the incorrect tags and it`s attracting the wrong audience?
In general, the body of the graph will show a gentle slope. But the steeper the slope the quicker you are losing your audience. You want a graph that is relatively flat through the body because it means your audience is engaging with the content.
The tail often has a sudden drop as well as your audience anticipates the end of the video. It’s like a movie theatre, few people hang around for the credits. So if you want to people stay, do not use terms like “… and in summary.”
Relative Audience Retention
Relative audience retention compares the audience retention of your video in terms of interest and compares it to other similar length videos.

First look at how it compares to the average, is it generally above or below the average. But more importantly an upward curve means people are paying more attention to that segment of the video. A downward slope indicates you are losing their interest at that very moment in the video.
Since it tracks directly to your video, you have a way to judge what is working and what is not by directly reviewing the segment of your video that is having that impact.